After this practical you will:
In this practical you will use the macromolecular crystallographic modelling tool, "O", written by Alwyn Jones.
Copy the files in directory /chalmers/users/kemp/TDA506/practical5/ to a directory of your own.
To run O, open a terminal window and type:
./run_O
and then press "Return" six times to accept default values. Seven menus are shown at the top of the main graphics window (Controls, Display, Graph, Rebuild, Bones, Density and Menus). Click on some of these to see what they contain, e.g. click on "Menus -> Objects", then "Menus -> User menu". An information line is shown above these menus. When working with O, we need to see the graphics window and the terminal window where commands can be entered, so arrange the windows on the screen so that both can be seen at the same time.
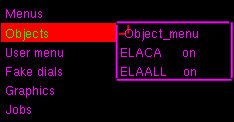
We shall now read a menu file to add some useful commands to the User menu, so that these commands can be accessed conveniently. After typing the following command, click on "Menus -> User menu" again:
read menu.odb
To read the PDB file containing elastase, associating the name "ELA" with that molecule, type the following command, and press "Return" twice to accept default values:
pdb_read elastase.pdb ela
While the PDB file has now been read, the molecule is not yet visible in the graphics window. We can use the centre_atom command to display the molecule with a specified residue at the centre of the graphics window. For example, to place the alpha-carbon of residue B195 at the screen centre, type:
centre_atom B195
An alpha-carbon trace is now displayed. To rotate the molecule, place the cursor in the graphics window, press the right button on the mouse, and move the mouse. To zoom and change the "slab" parameters, press the middle button on the mouse, and move the mouse.
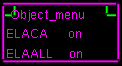
To see all of the atoms in the structure, click on "Display -> All atoms". A wireframe representation of the structure is now shown in addition to the alpha-carbon trace. You can toggle the displayed objects using the Object_menu:
It is sometimes convenient to have these sub-menus permanently available in the graphics window. This can be done by clicking on the small "red square" in the top-left corner of the Object_menu. On doing this, that red square is removed, and two "green squares" are displayed at the top of the Object_menu. To move the Object_menu, place the cursor inside the "green square" in the top-right corner, press the left button on the mouse, and drag to place the menu (e.g. to the left side of the graphics window).
We shall now draw all symmetry related atoms within a sphere of given radius, centered on residue B100. First, make residue B100 the active centre, and then use the symm_setup command:
    centre_atom B100
    symm-setup
Press Return to accept the molecule name ELA, and again to accept the cell constants. When prompted for the name of the spacegroup, type:
P212121
To view the symmetry-related molecules (symm-sphere command), type:
symm_sphere
Press Return to accept the molecule name ELA, and again to accept the molecule name sym and enter 15.0 as the sphere radius. View the symmetry-related objects, turn off the ELACA object, and repeatedly toggle the ELAALL object off and on quickly so that the region of contact between the original elastase molecule and the symmetry-related copies can be visualised more easily. Measure the distance between the side-chain oxygen atoms of residue B102 and a nearby arginine residue. To do this, click on "Dist_defin" in the User menu, then click on two atoms. Comment on these interactions, and the possible effect of crystal packing on molecular conformation.
We shall now view the electron-density data on which the model structure of elastase is based. Use the F(ast)-m(ap) command fm_file with map file "2fofc.map", map name "2fofc" and space group "P212121", as follows:
fm_file 2fofc.map 2fofc P212121
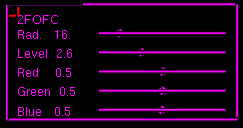
To display the map, use the "Density -> 2FOFC" sub-menu:
I recommend displaying this sub-menu permanently in the graphics window. Experiment with the sliders. Locate residue B98, and notice the distinctive shape of a tryptophan side chain (set the level somewhere between 2.5 and 3.0).
One residue in the structure has particularly unfavourable values for its phi and psi angles. Further, if we look at the electron-density in the region of that residue, we can see that the model has the wrong side-chain for that residue. Click on "Graph -> Ramachandran". Clicking on a dot in the Ramachandran plot will place that residue at the centre of the screen. Identify the residue that has been modelled incorrectly. According to the electron-density map, what residue type should be at that position in the model?
Modify the model by changing the type of that residue, and fitting it to the electron-density data. Click on "Rebuild -> Mutate", then select the residue type that you want, then click on an atom in the residue that you want to mutate. The remodelled residue will be shown in purple.
The remodelled residue does not fit inside the electron-density. We can improve the fit by adjusting this residue's torsion angles. Click on "Rebuild -> Torsion -> In Residue", then click on an atom in the purple residue. Add the "Dial Menu" to the graphics window ("Menus -> Fake dials"). At the foot of this menu there are dials for PHI, PSI and side-chain CHI angles. To adjust these angles, place the cursor on the angle name, press the left button on the mouse, and move the mouse to the left or to the right, or use the left and right arrows on the keyboard.
Gerard Kleywegt has produced an excellent tutorial on model validation.