Your task is to write a program similar to Västtrafik's travel planner. Given the necessary information about what tram lines connect which stops, your program will travellers to find the fastest route between two stops. The travel total time of travel is calculated by summing up the time it takes to travel between the fastest route's consituent stops.
The tram lines and stops are described in two text files, described below. Your program will read these files and create a directed graph for the described lines. You will also implement Dijkstra's algorithm and use it to calculate the shortest path between two given tram stops.
computePath, which calculates the shortest path between
two nodes in a graph,
getPath, which returns an iterator containing the names
of the nodes along the last calculated path, and
getPathLength which gives the total travel time of the
path returned by getPath.
Graph -> String -> String -> Maybe ([String], Int).
Given a graph and two nodes (represented as Strings), this
function returns a pair of:
Nothing. You may define the Graph type yourselves.
To get you started, you're given a package, Lab3Help, with helpers for reading tram lines and stops from their respective text files, as well as a GUI for visualising the results of your algorithm.
Lab3GUI.
The following files containing information about tram stops (noes) and lines (edges) can be used for testing your implementation.
Here follows a description of the file format of the tram line files.
You don't have to parse this format yourselves; Lab3Help
contains code to do this for you.
The stops file in each pair of files contains information about
the stops (nodes) in the graph and has the following format:
  Brunnsparken                    500     500
  Redbergsplatsen                 700     350
  Frölunda-Torg                   200     900
Each line contains the name of a tram stop and its coordinates, given as integers between 0 and 1000. The coordinates are used to draw a map of the tram network and the calculated shortest path between two stops.
You can parse tram files using the readStops method/function.
In the Java package, this method is found in the class Lab3File.
The method/function returns a list of BStops. Each element
represents a tram stop and carries information about its name and
coordinates.
The lines in each file contains information about the tram lines
(edges):
  60 5
  Redbergsplatsen
  Drottningtorget         5
  Chalmers                2
  Drottningtorget         2
  Redbergsplatsen         5
  34 7
  Östra-sjukhuset
  Olskroken               6
  Centralstationen        3
  Tuve                    7
  Centralstationen        7
  Olskroken               3
  Östra-sjukhuset         6
The first line contains the tram line number followed by the number of stops that tram calls at. Then follows a list of those stops with one stop per line. Each line contains the name of the stop, and the number of minutes it takes the tram to travel to the stop from the previous one.
Line files can be parsed using the readLines function/method,
which returns a list of BLineTables. Each
BLineTable represents a single tram line, and contains the
line's number as well as the stops the tram calls at. These stops are
represented by BLineStop objects, containing the name of a stop
and the travel time to this stop from the one before.
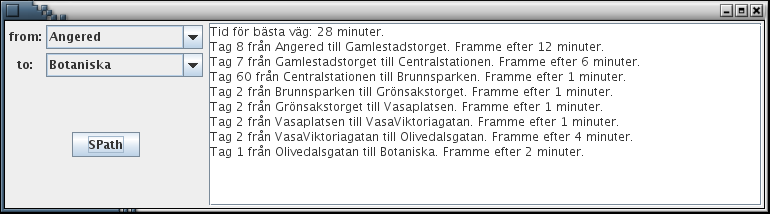
Your main program will calculate the fastest route between two tram stops, tell the user which stops are along this path, and the time it takes to travel between the two stops.
You may decide for yourself whether to use the given GUI utilities or not.
If you don't, it must be possible to give the program a graph (expressed as
a stops file and a lines file) and two stops on
the command line.
Your main program must be separated from your implementation of the graph and Dijkstra's algotithm. Any output or graphics must be handled by the main program.
You must use adjacency lists to represent graphs. Your graph implementation and implementation of Dijkstra's algorithm must be reusable and independent of the rest of your program; it should be possible use your graph implementation to construct other graph algorithms not related to Dijkstra's.
Dijkstra's algorithm must be implemented so that it has a worst case time complexity of O((m+n) log n), where m is the number of edges and n is the number of nodes in your graph, so it's important that you use a sufficiently efficient priority queue:
Data.PSQueue is described in Hinze's "A Simple Implementation
Technique for Priority Search Queues" (see the
course litterature), which also
contains an implementation of Dijkstra's algorithm. Note, however, that
Hinze's solution only gives the shortest distance between nodes,
not the shortest path. The code is also described using "views", which
Haskell does not support. The following version of Hinze's code may be
easier to follow:: HinzeDijkstra.hs.
Data.PSQueue, run the following commands in
a terminal: cabal update followed by
cabal install PSQueue.
You may use the standard libraries if you like. For instance, HashMap (for Java) or Data.Map (for Haskell) may be useful to look up strings.
In the helper Lab3Help package, there is also a simple GUI
helper, called Lab3Frame for the Java version and
Lab3GUI for the Haskell version, which you may use to visualise
your solution. This interface allows the user to choose their start and end
points, and get a visual representation of the time it will take to get
there and the stops they will pass on their way.
The Lab3GUI (Haskell) and
Lab3Frame
(Java) functionality is described in the documentation.
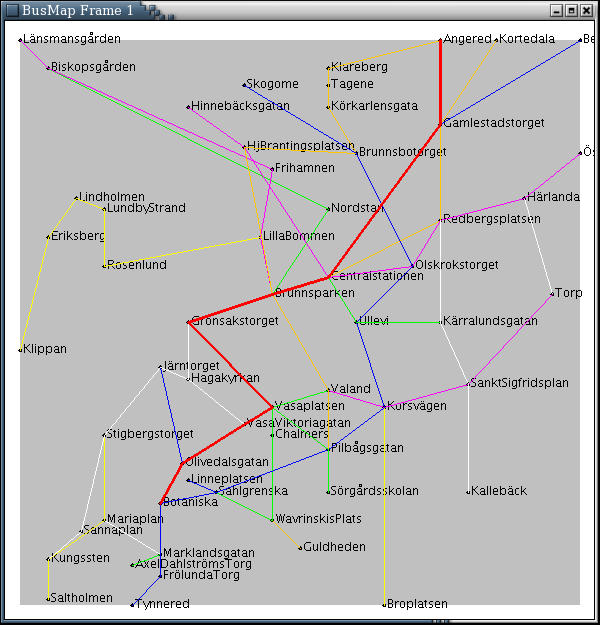
To draw a map of all the tram lines and the shortest path between the two
currently selected stops you can use
BusMapFrame (Java) or
Lab3GUI.runGUI (Haskell).
This is not only pretty but also helps you spot and eliminate bugs in your
code faster.
The Haskell GUI helper uses your web browser to render its graphical interface. If you use Haskell, compile and start your program, and point it to http://localhost:8888 to try out your submission.
You should test your program on a few small graphs (which you define yourself) before taking on the large graphs given above.
Make sure to test your program thoroughly, and that you get the correct result for all graphs you try. To do this, you should make sure that you don't get any weird, unexpected results (for instance, if your "shortest path" from Angered to Bergsjön includes a detour through Brunnsparken, you probably have a bug in your code).
There is also a test program you can use to check your code. Any solution which does not pass this test suite will be summarily rejected.
The test program can be used for both Java and Haskell submissions. If you
use Java, your implementation of the Path interface will be used
for testing. Note that computePath may be called several times
on the same object.
Submit your documentation, your code, and any other files relevant to your solution (i.e. your own graphs, etc.) Do not submit junk files or any of the files provided by us (testing.jar, Lab3Help.jar, Lab3GUI.hs, the graphs given above, etc.) Do submit Path.java if you used Java for your solution.
Your submission must, of course, follow the usual guidelines. If you are using any of the provided utilities or GUI code, you don't need to provide any documentation for those.