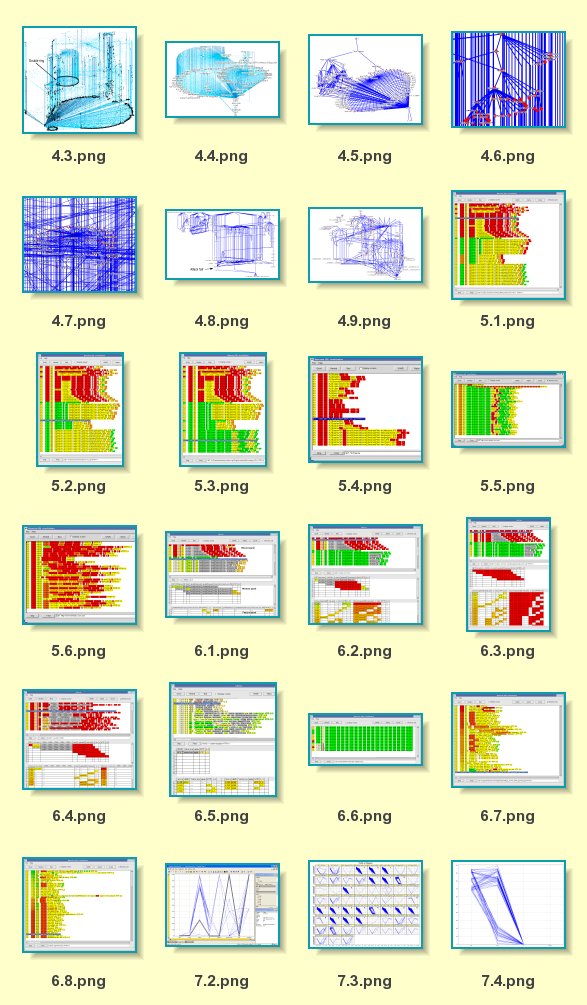
| Page | Figure | Caption | |
|---|---|---|---|
| 53 | 4.3 | Graph of the lowest scoring requests | |
| 54 | 4.4 | Zoom on feature (Spam attack in this case) | |
| 55 | 4.5 | Zoom on feature (benign accesses forming a subgraph, isolated) | |
| 56 | 4.6 | Zoom on feature (benign accesses forming a subgraph, in vivo) | |
| 57 | 4.7 | Zoom on feature (benign accesses forming a not very clear subgraph) | |
| 60 | 4.8 | The remaining accesses deemed to be intrusion attempts, 2D graph | |
| 61 | 4.9 | The remaining accesses deemed to be intrusion attempts, 3D graph | |
| 75 | 5.1 | The Bayesvis tool | |
| 78 | 5.2 | The Bayesvis tool after retraining on false alarms | |
| 79 | 5.3 | The Bayesvis tool after having corrected under training | |
| 83 | 5.4 | False positives during the training phase | |
| 84 | 5.5 | Examples of false alarms in February log | |
| 86 | 5.6 | Generalized detection of Unicode attacks | |
| 93 | 6.1 | The Chi2vis tool after training one bad and one good | |
| 96 | 6.2 | The Chi2vis tool after training one bad and two good | |
| 97 | 6.3 | The Chi2vis tool after training two bad and two good | |
| 102 | 6.4 | Generalising the Unicode training to detect new instances | |
| 103 | 6.5 | False alarms: Example of the HEAD-pattern | |
| 104 | 6.6 | Results from training on syscall data | |
| 107 | 6.7 | All the false alarms of Bayesvis | |
| 108 | 6.8 | The "cgi-bin" pattern false alarms of Bayesvis | |
| 116 | 7.2 | A simple parallel coordinate plot | |
| 120 | 7.3 | A trellis of parallel coordinate plots | |
| 122 | 7.4 | A plot of the "Code-red" worm access pattern | |
| 123 | 7.5 | The six different requests made by pattern 1 from Figure 7.3 |